Multiple trapeziums = multiple sets of parameters. That makes sense right?
However when it comes to determining within which trapezium your grey level falls, which set of parameters do you feed in? Trapezium 1? 2? 3? How do you feed them all in?
The evalmf function in MATLAB takes the following structure:
y = evalmf(x,mfParams,mfType)
- x = variable range
- mfParams = the parameters for the type of membership function you''re utilising
- mfType = type of membership function you're utilising
No amount of Googling led me to a result in which I could feed in three sets of mfParams. So what next?
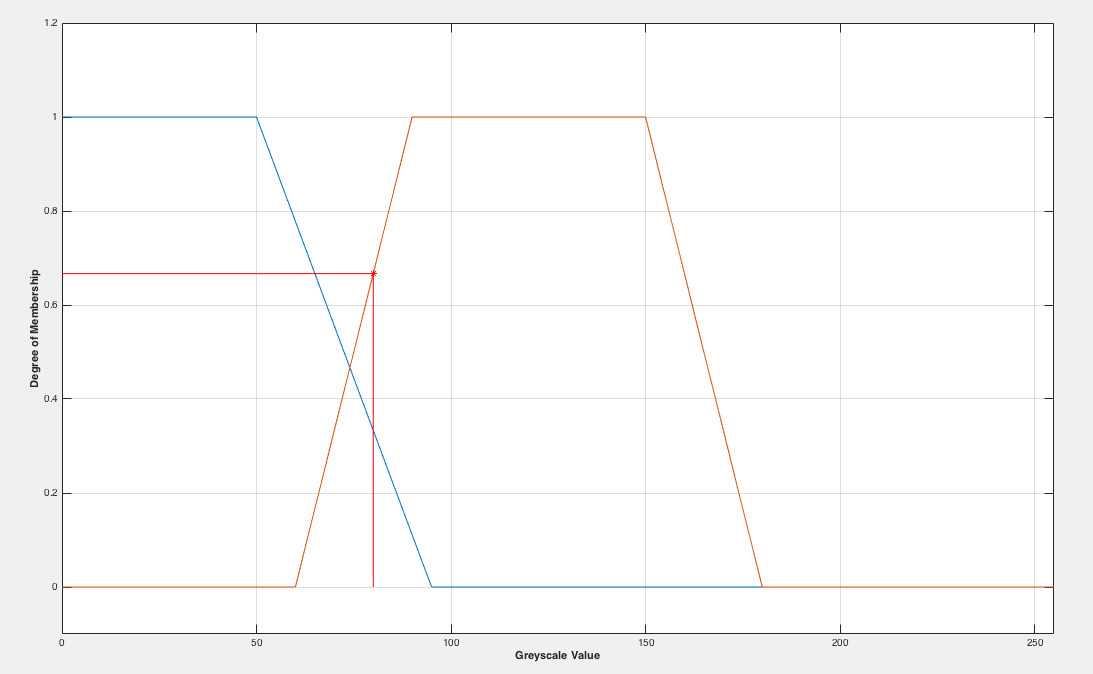 Don't be fooled, Figure 1 isn't showing a successful plot, it's showing what happens when you feed in the second trapeziums parameters into the evaluation function. Seems right, but that's just a coincidence.
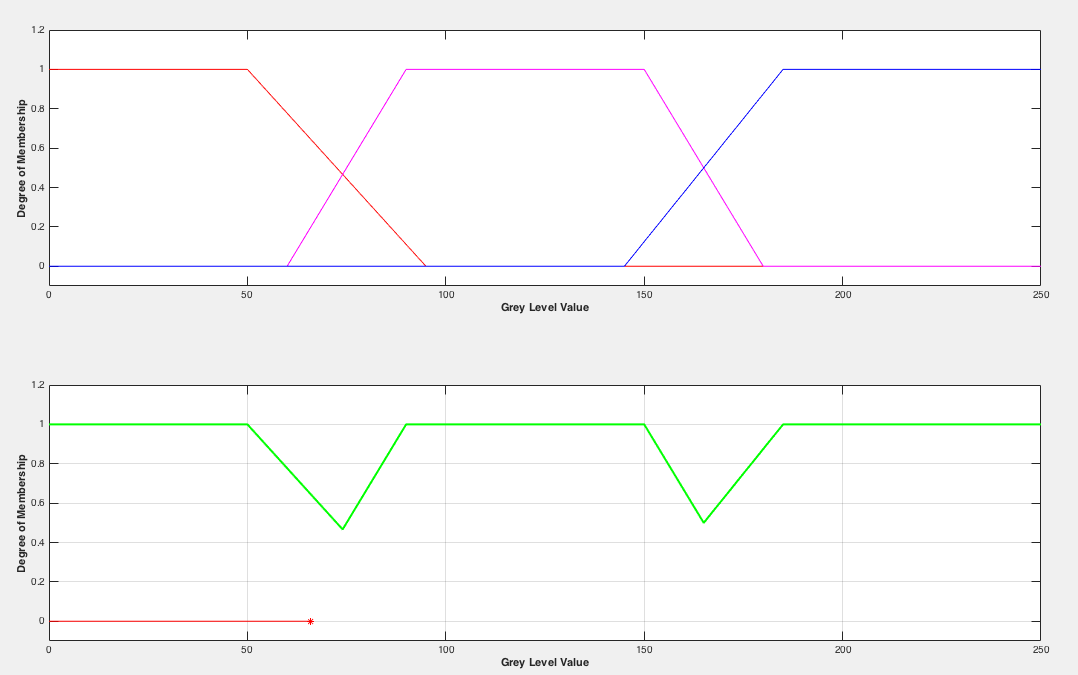
On the top here you see the three plotted trapeziums. On the bottom is the maximum values of the three trapeziums. I used this idea to see if this was a viable way of plotting the maximum degree of membership. Note: it''s not.
Finally, after brainstorming with my peers, I happened upon a some-what 'hacky' way to feed in the 3 separate parameters and to evaluate the degree of membership for each trapezium. By evaluating the grey level value against each of the three sets of parameters and extracting the one with the maximum value, it is indeed possible to plot the degree accurately.
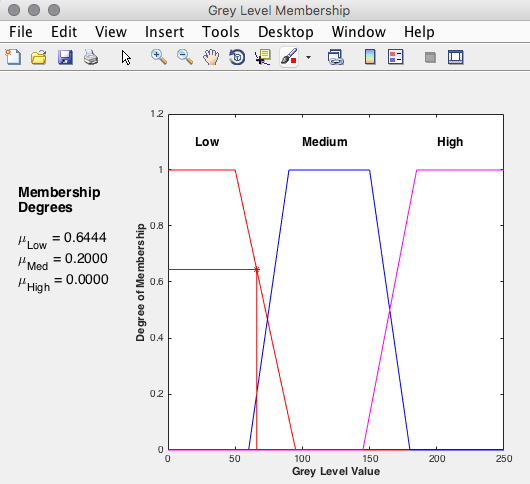
As you can see on the left, each membership degree is calculated, and then the highest is chosen as the y value in plotting the grey level value.
BINGO - SOLVED
If anyone knows of a way to utilise the 'evalmf' or 'evalmmf' functions with multiple membership function parameters, please let me know!
Up next
- Tweak the Trapeziums to fit better within grey levels
- Integrate this code with a Fuzzy Entropy equation which utilises the membership function