I'm sure there's been more than 3 hurdles, but this is only the third interesting one!
These images far better explains 'odd output' than I could ever do in words:
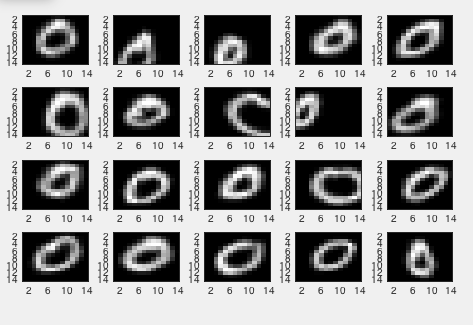
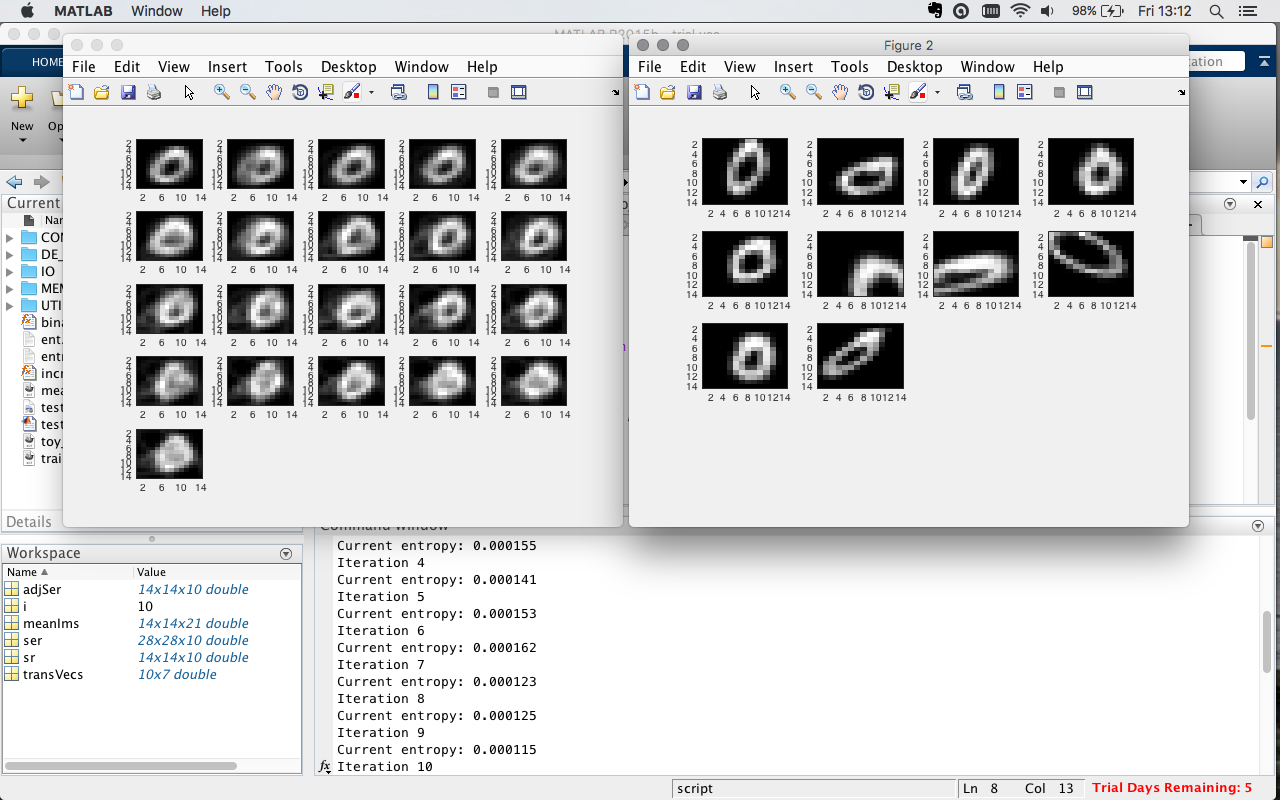
Why do the adjusted 0s creep out of their boxes?
This has all to do with over-congealing the image.
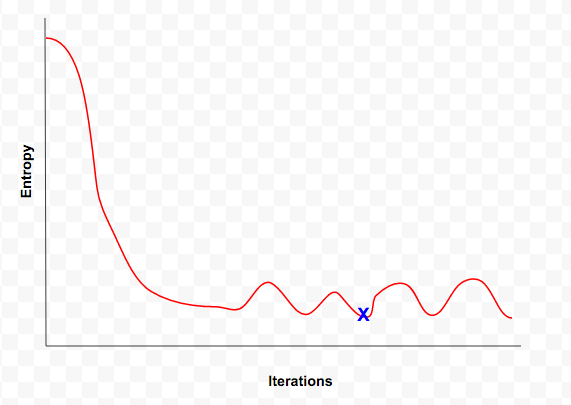
Note to self: make a proper graph for my final report
As the entropy drops, eventually it will plateau and stop decreasing. If you carry on iterating over it, eventually we will start to see oscillations in the entropy. This leads to the adjusted inputs becoming more and more obscure.
The blue cross signifies the global optima, however you will note that there are several local optima before hand, which explains readings such as:
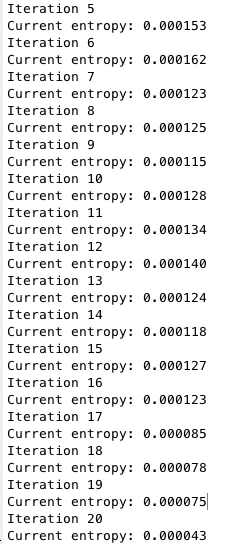
This is something I need to look into. I wouldn''t want to add a conditional statement that
if (entropy_2 > entropy_1)
   then stop
because it would always stop in the first local optima. But then how long do you allow it to oscillate before you put a stop to it?
This is something which might not be overcome during the project, however I should add a recommendation of number of iterations per alignment metric to the user.