This week started off a little slow as I was stumped as to how the existing Congealing code creates a pgm suitable to feed into the Congealing algorithm. However, today (Friday) has seen a massive leap forward in progress! :)
Figure out what the header in the MNIST generated pgm files means
Edit testCongeal function to take parameters
Create some slides for mid-project demo
Start GUI
Give the GUI some functionality
Meet with Fangyi Li, a PhD student with Congealing experience
Implement function to read in mammograms and concatenate images together (sort of)
Run congealing on mammograms
MNIST Header data
So in the existing Congealing code there is a function for converting the MNIST dataset into sets of pgm files (1 file with all 0s, 1 file with all 1s etc...).
I noticed the header of each of these files contained a comment line on line 2, and upon further investigation into the loadSeries function, this comment is actually used! Madness.
The pgm format wiki really helped me break down what it was the non-commented lines were, but it took some thinking to calculate what this remaining comment line actually meant.
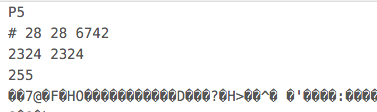
P5: this is the magic number specifying the type. P5 = pgm
2324 2324: height and width of the image.
255: maximum grey-level value in the file
But it remained, what does ''28 28 6742'' mean?
Pretty quickly I could calculate that 28 28 was in fact the square around each individual MNIST number in the file. This was further backed up by information supplied on the MNIST page about 3/4s of the way down the page.
But 6742? Was that the number of instances in the image?
2324 / 28 would give 83 instances per row. \n83 * 83 = 6889! Not 6742? Peculiar.
Later I conceded that it was in fact the number in the image, however due to some ceil and floor functions to help ensure the image is perfectly square, no matter the number of instances in the image, the total doesn''t equal what you would expect.
On close inspection of the actual image files, you can see the blank space left by ensuring the image is square:

I must extend a massive thank you to Fangyi Li for taking some time out of her day to sit down and walk through a few of the MATLAB functions with me. It was an amazing sanity check, and just talking over what the existing code was doing gave me ideas as to how I could read in my mammograms!
Edit testCongeal to take params
What it says on the tin really. I edited testCongeal to be a function, not a script, so it could take the input variables of:
- which metric to use to align the images
- how many iterations
This means it's easier for the user to specify actions to be run without having to hard code it into the function itself.
To do: later will need to further edit to allow to pass in image file
Implement function to read in mammograms and concatenate images
Once I had figured out what header information was needed by the loadSeries function, and had my suspicions confirmed by Fangyi, I set about creating a function to read in the mammogram pgm files, and to join them together into one large image.
Due to time constraints of mid-project demo being next week, the paths to the files are currently hard-coded, but this will be rectified later when integrated with the load button on the GUI (hopefully).
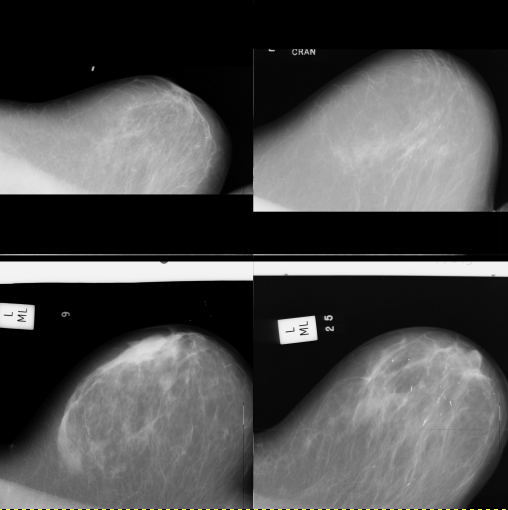
Let's take my 4 sample images from the Mini-MIAS dataset 1:

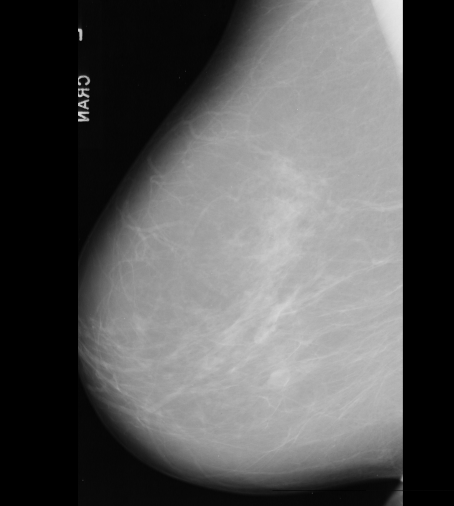
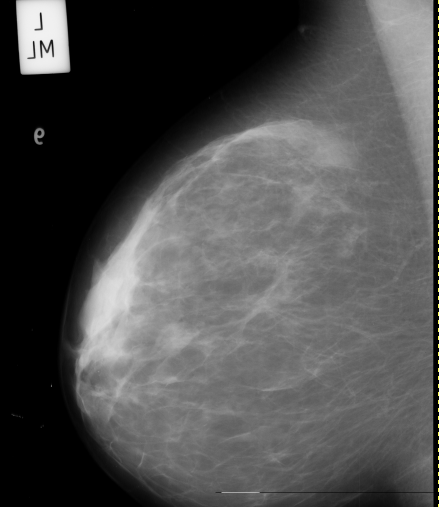
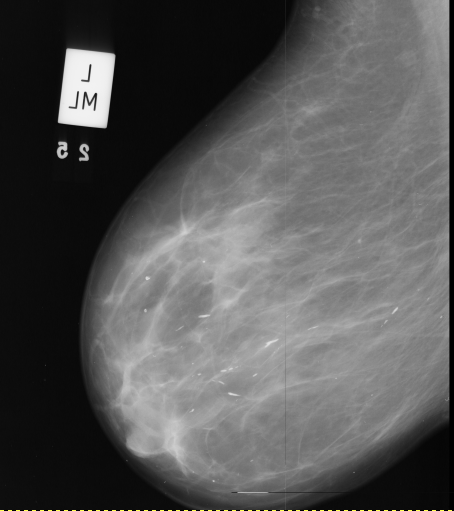
Note: These scans are all of density category 1.
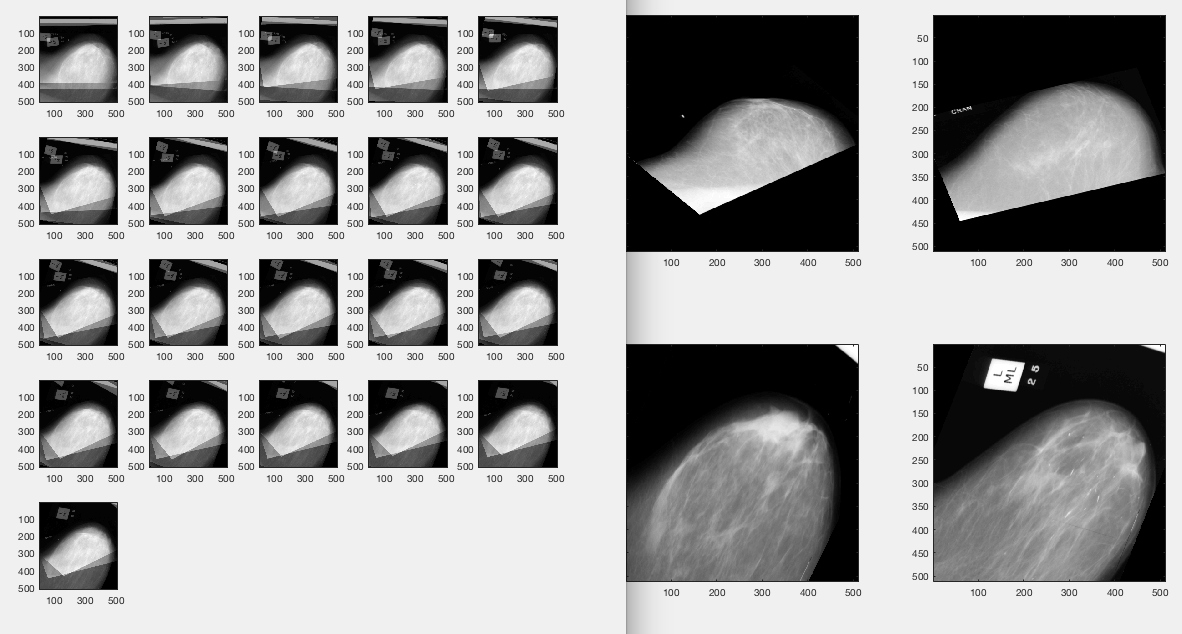
And let's join them together into 1 large image:
They've...rotated? Why? I'm not sure yet... But as they''re all facing the same direction, this isn't a massive issue. Just aesthetically it's not brilliant.
Note: it''s important to use scans which are all facing the same direction (all right/ all left) as the Congealing code does not work to flip images over to align them. I also feel me implementing this may be a step too far, and it's currently easier to just mirror any images facing the opposite direction.
Further note: That said, mirroring images in GIMP causes an extra issue. GIMP writes a comment line in the header of the pgm file when you make any edits, which effectively 'breaks' our image in terms of feeding it in. Any attempt to remove the GIMP comment, or to add another comment underneath it, corrupts the file, rendering the image unusable. So for now, I am using only scans which are originally facing the same direction.
Run Congealing on Mammograms
Such large images makes my De-Luca implementation painfully slow, so optimisation is desperately needed. Until then, I can run a small number of iterations using De Luca, and can run a much larger number of iterations using Shannon entropy.
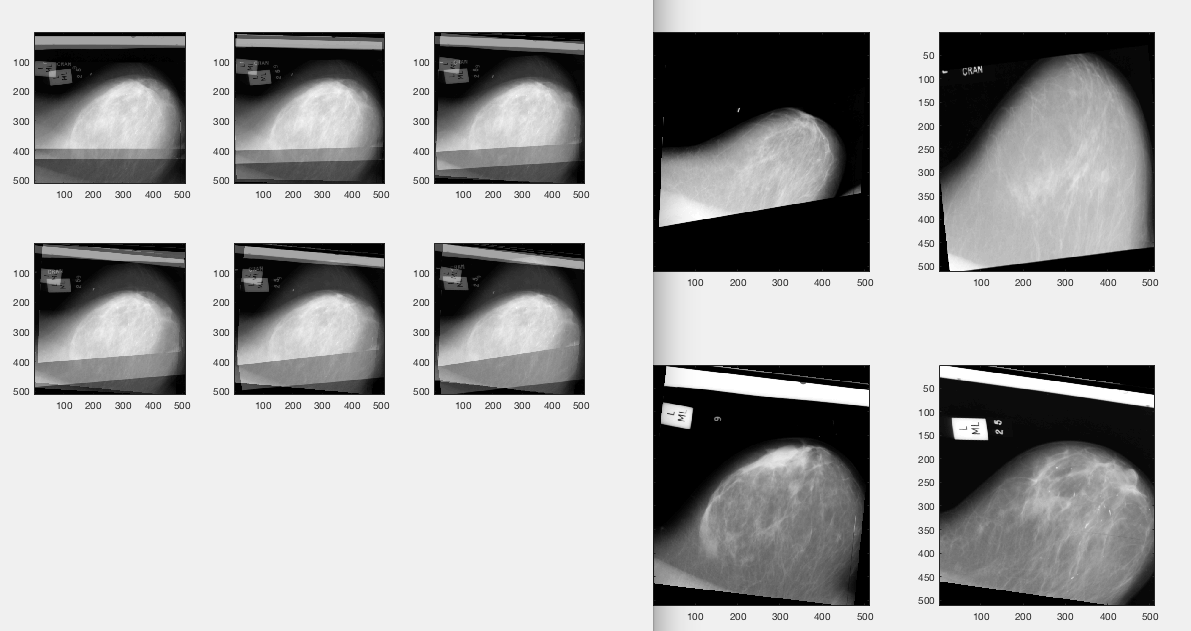
See outputs below. The left of the image is the mean image on each iteration. The right of the image is the adjusted original input image at the end of congealing process.
Shannon Entropy
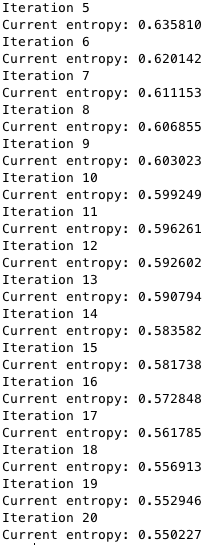
Slow fall in entropy, but steadily decreasing. Would be interesting to see where this plateaus.
De Luca & Termini
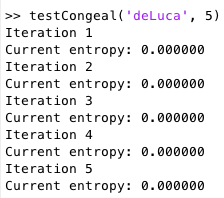
Why is the entropy 0? Could it be 5 decimal places isn''t precise enough? I'm not sure, as there is obviously improvement through the iterations.
This will be something to discuss with Neil on Monday.
Next Week
- Mid-Project Demo on Thursday morning
- Lovelace draft poster due Friday
- Edit pictures to remove medical markings?
- Figure out why it rotates the images when concatenating
- Figure out why entropy = 0
- Finish off De Luca report
J Suckling et al (1994): The Mammographic Image Analysis Society Digital Mammogram Database Exerpta Medica. International Congress Series 1069 pp375-378. ↩